Dashboard
The Dashboard is the first page that you see after signing in to CloudCasa. It shows you an overview of your configuration and the status of your backups.
As with all CloudCasa pages, the menu bar displays the main navigation tabs: Dashboard, Clusters, Databases, DR, Reports, and Configuration. In addition to these tabs, there are the following buttons in the menu bar:
- Support
Click this button to open the support dialog. You can use it to send a message directly to the CloudCasa support team. You can also contact support by sending email to support@cloudcasa.io.
- Help
Click this button to open the relevant document page in the CloudCasa User’s Guide.
- User Menu (≡)
Displays the name and currently selected organization for the logged in user. Click the menu button (≡) to access additional options, including organization switching, user settings, and logout.
See also
See User Settings.
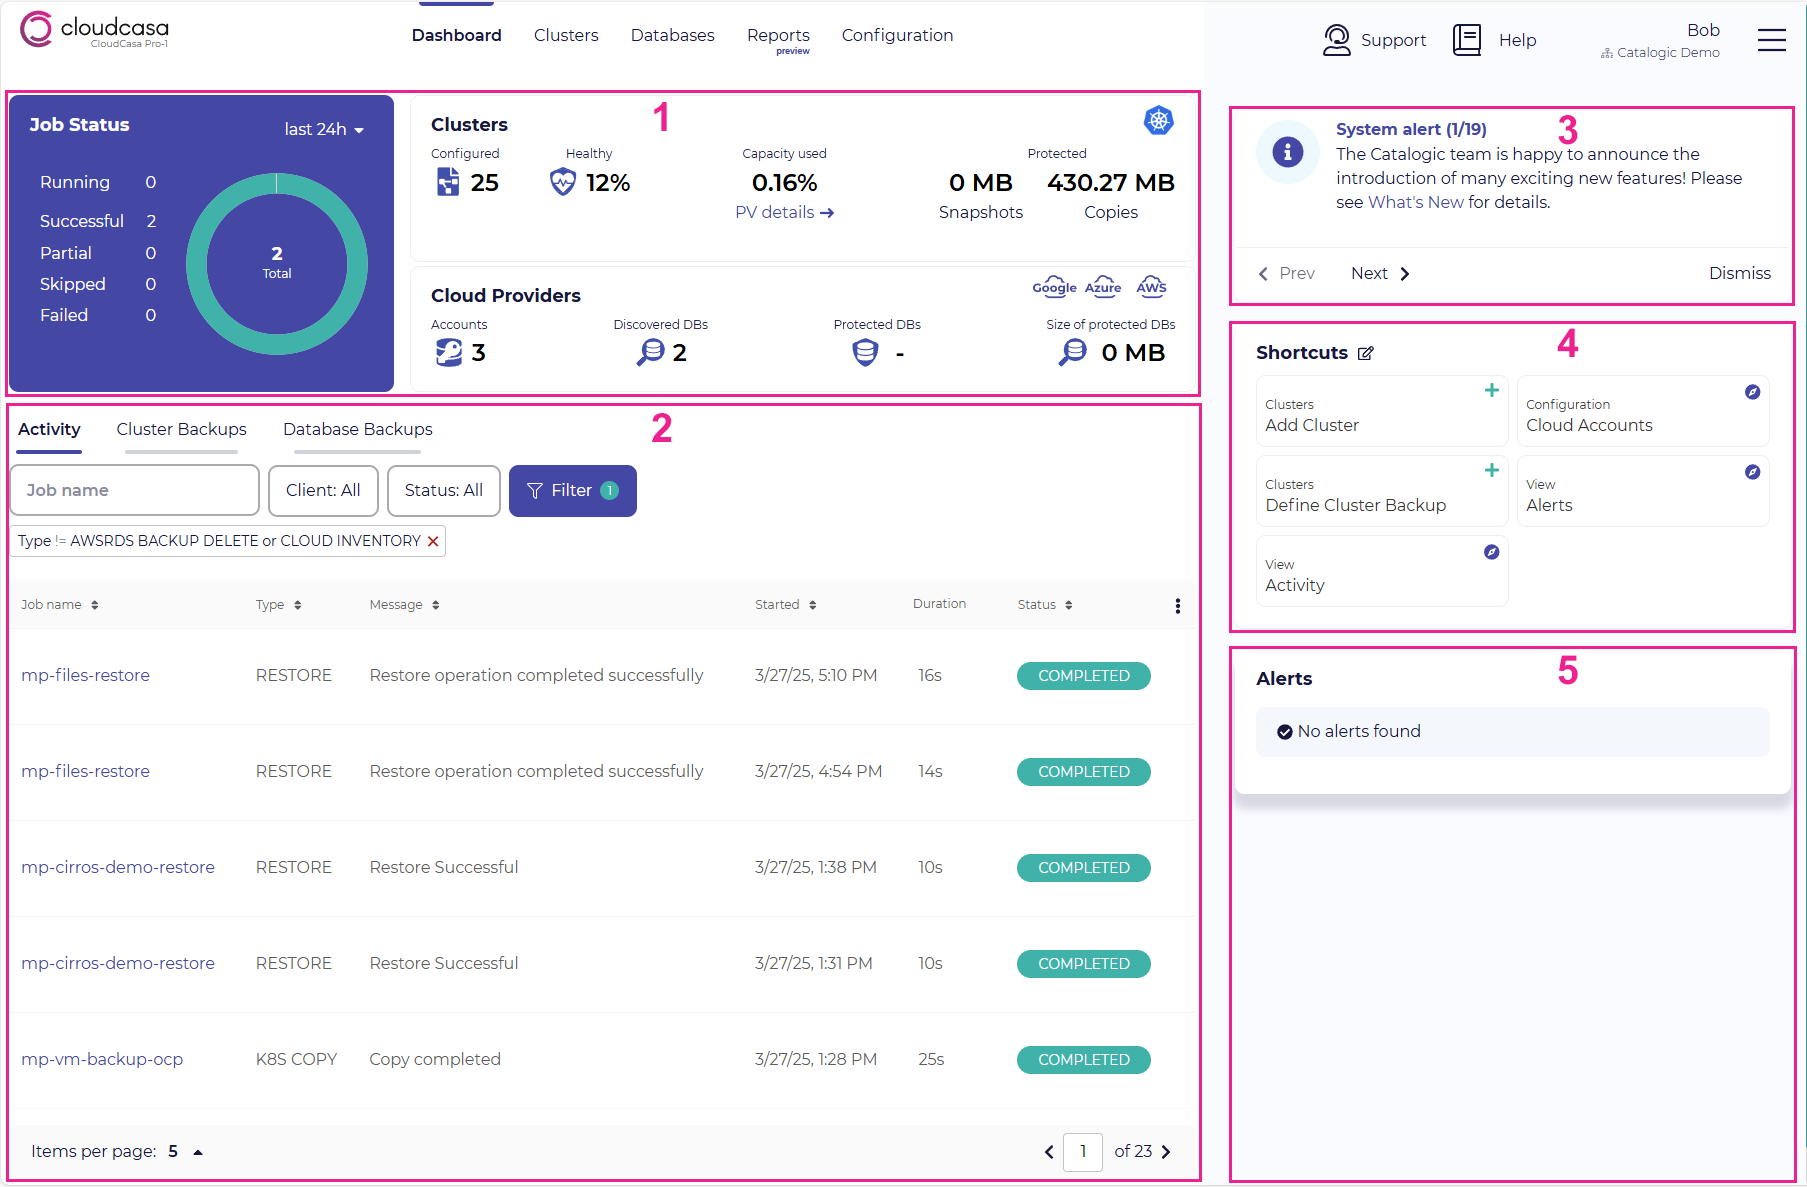
In the main pane of the Dashboard page, there are the following sub-panes:
In the status pane, you can see a summary of backup job history, the status of your registered Kubernetes clusters, and a summary of your registered cloud provider accounts.
The Activity & Backup Jobs pane contains three tabs, Activity, Cluster Backups, and Database Backups.
In the Activity tab, you can see information about important job activity, such as the current status or completion results for each backup job.
See also
Click See more ► to open the Activity Details page containing more detailed job activity information. See Activity.
In the Cluster Backups or Database Backups tabs you can see a list of your configured backup jobs for Kubernetes clusters and cloud databases.
For each cluster backup job definition, you will see the associated policy and cluster, the date and time of the last run, and the results of the last 3 runs.
For each cloud database backup job definition, you will see the associated policy, the date and time of the last run, the results of the last 3 runs, and the number of databases in the backup.
For either tab, you can initiate a backup or restore using the provided actions. Moreover, you can quickly define a new backup by clicking Define backup.
Whatever tab you select in this pane will be selected by default the next time you return to the Dashboard, so your favorite tab will be available at a glance.
In the notification pane, you can see the following types of notification messages:
Product information: Notification messages about the CloudCasa service, such as system maintenance notices and announcements regarding new features.
Error notification: Notification messages about errors such as unreachable clusters or inaccessible cloud provider accounts. If you see Open ► in the notification pane, click the button and you can edit the object that has the issue.
Payment notification: Notification messages about payment for CloudCasa paid services, such as expiring credit cards.
The Shortcuts pane appears by default above the Activity and Alerts tabs, complete with some default shortcuts. You can remove or re-order shortcuts by clicking on the edit icon. Click the trash icon to delete a shortcut, or drag shortcuts up and down in the list to reorder them. To add a new shortcut, navigate to the page you would like to link to and click the star icon located next to the page title or in the upper right corner (you can also toggle it off by clicking on it again).
If you don’t wish to see the shortcuts pane, simply remove all the configured shortcuts and it will disappear entirely. Starring a new page will cause it to re-appear.
In the Alerts pane, you will see a listing of any alerts for your organization with brief information about each. Clicking on an alert will open a pane with more information about it. You can clear all alerts using the Remove all button, or select and clear specific alerts using the checkboxes on the left.
See also
Click See more ► to open the Alerts page, which allows you to more easily view and manage large numbers of alerts. See Alerts.